Rosco Reports III
by Ross Thrasher
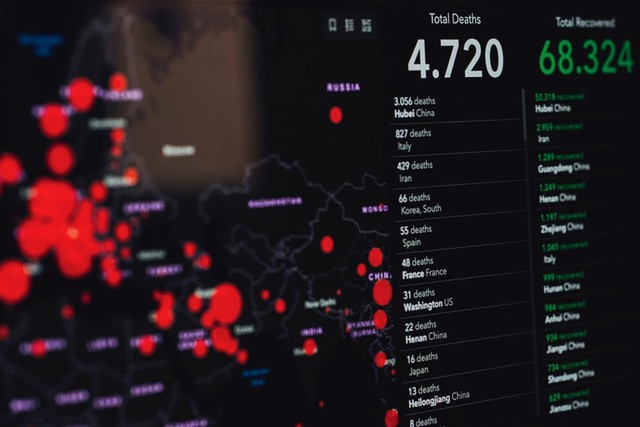
On April 15 the global tally of coronavirus cases passed the two-million mark, growing by 80,000 daily. 25% of these have recovered and 6.5% have died.
In the media there has been much discussion of “the curve”, the typical trajectory of COVID-19 cases and fatalities in various jurisdictions over time, as depicted by bar charts and line graphs. The authorities in those nations that are in the midst of the pandemic have been trying to anticipate how their curves will play out, and how soon they can resume normal operations. But predicting, and managing, the severity and duration of the disease in any location is an inexact science. What can we learn from the experience of other countries?
China, where it all began, shows a fairly symmetrical hump of cases and deaths (if you can believe their numbers). The new cases started to rise in late January, peaked in early February and tailed off a couple of weeks later. Of course China, to flatten the curve, enforced some draconian quarantines and built some instant hospitals, measures that might not be acceptable or possible in some other countries. The deaths curve followed a similar path about two weeks later, allegedly petering out by the end of March, and now most survivors are said to have recovered. The whole process lasted about nine or ten weeks, and a week ago restrictions were relaxed in China.
Iran, one of the early countries afflicted, provides another interesting example. Iran started to experience a steady rise in new cases around March 1st, and this number kept increasing, bobbing along at around 1000 new daily cases for three weeks, then spiking until it cleared 3000 per day by the end of March. Since then new cases have declined gradually to 1500 a day in a near-perfect Bell curve formation. And now almost two-thirds of the documented victims have recovered. Iran’s deaths from the virus have formed a flatter curve, ranging between 100-150 deaths per day from mid-March to mid-April, over 4800 in total now (6% case fatality rate). But the deaths graph may have a long tail, as Iran still has nearly 3600 serious/critical virus patients. And there hasn’t been much testing.
Germany, arguably the most effective country in Europe at containing the virus, shows a fairly complete up-and-down curve of cases from mid-March to mid-April, over 50% recovered, and a low case mortality of 2.5%. Early high-volume testing, aggressive contact tracing and physical distancing clearly contributed to this positive outcome.
Other EU members who were hit much harder — Italy, Spain, Netherlands — have started to decline from their apex of new cases in recent days, but daily fatalities remain high. France, the UK and Belgium are still peaking or plateauing. It seems too soon for these countries to safely assume that they have conquered COVID-19 and that they can now open up their economies, but Spain has just elected to do so in a modest way. We’ll see how that works out for the Spaniards, who currently own the world’s highest death rate compared to population.
Sweden has not followed the lockdown strategies of most other countries, leaving elementary schools, restaurants and public spaces open. Sweden has also done less virus testing than the other Nordic nations. The result to date is a Swedish case-fatality rate exceeding 10%, and 1000 more deaths than any of its neighbours Denmark, Norway and Finland.
The USA is a special circumstance: a geographically vast country with a large population, mainly clustered in big cities. The US already has 30% of the world’s cases and 24% of the deaths. New York has become the deadliest epicenter in the world with 226,000 cases and 16,000 deaths. The Empire State may have just reached its peak of new cases this week, but New Jersey, Michigan, Massachusetts, Louisiana and other states are not yet over the hump. The death apex is normally about two weeks behind the top of the new-cases curve. Would it not be the height of folly to ease restrictions anytime soon, especially on a national level, Mr. Trump?
Canada’s central provinces, Quebec and Ontario, appear to be surging this week while the smaller and less populated provinces on either side are leveling off. Restrictions are being extended coast to coast and testing is increasing.
There are a lot of possible variables to account for COVID-19 outcomes from country to country and state to state, e.g. age distribution, housing density, hospital capacity, pre-existing medical conditions, economic inequalities. But in general the entities that have done more testing and have maintained stricter distancing protocols are showing better results in flattening the coronavirus curve and coming down the other side fairly quickly.
Most of the world is still in the middle (or the upslope) of this pandemic. Long-term projections are a guessing game at present.
Sources: https://www.worldometers.info
See what else we have in GTEC’s Communication & Media (formally GTEC Blog)! Read articles on climate change, sustainability, education, and more!
Or, if you are interested in more blogs on the Covid-19 pandemic, follow the link here.