Professor Ed Hawkins at the University of Reading created the Climate Stripes. The University of Reading is ranked first place in the UK for the 2023/24 People & Planet University League, a compilation of UK universities ranked by environmental and ethical performance.
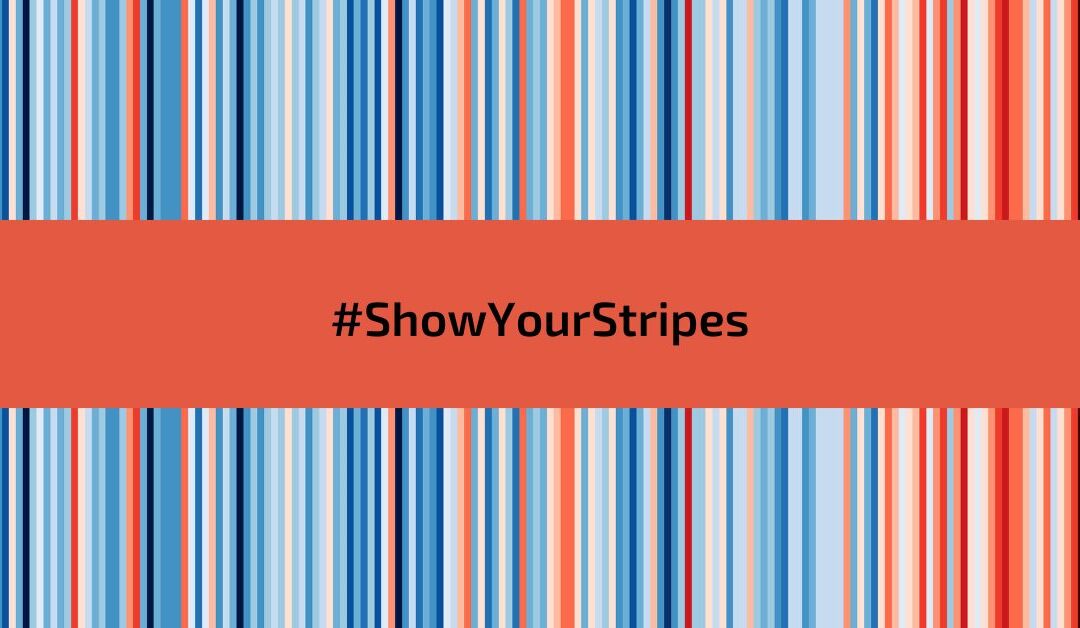
Show Your Stripes Day (June 21, 2024) is the University of Reading’s annual call for everyone to share their local stripes, sending a powerfully visual message about the impacts of climate change.
Each stripe represents the average temperature per year, relative to the average temperature over the whole period. Blues indicate cooler-than-average years and reds indicate hotter than average years.
The Show Your Stripes website allows you to select your Region, Country and Location to see the stripes for many locations around the world. For Vancouver, BC, the data range is 1850-2023 and the temperature change is shown relative to the average of 1961-2010. As you can see, for the past 25 years we have had significantly more warmer years than cooler ones.
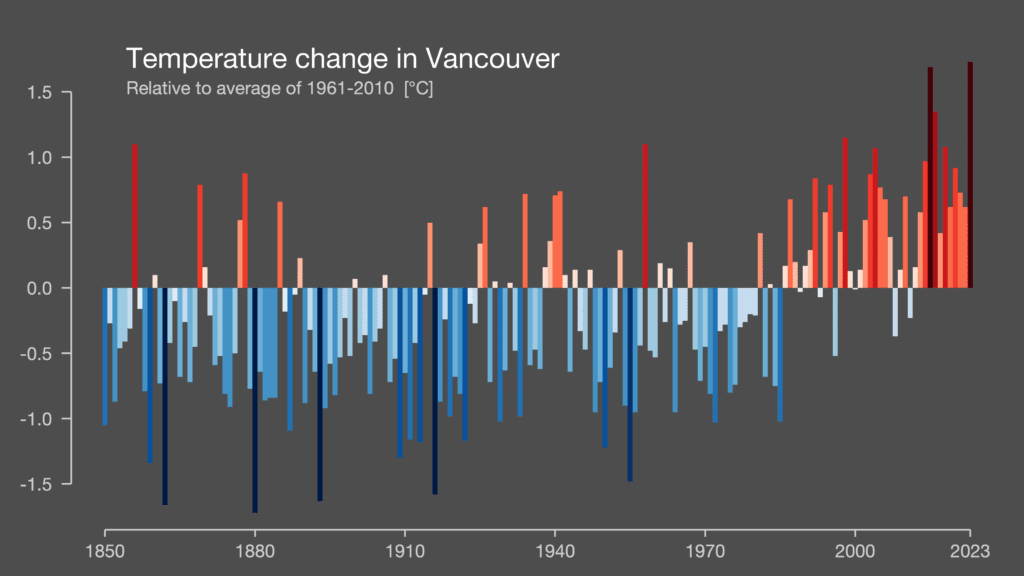
How much has your region warmed?
GTEC is at the forefront of solutions to the social and environmental challenges of our time. Our Climate Response Centre will be Canada’s first centre that combines a source of relevant and accessible educational and community development programming, and a centre of evolving community-based expertise about responding to climate change.
Read articles on climate change, sustainability, education, and more from GTEC’s Communication & Media (formally GTEC Blog)!